Overview
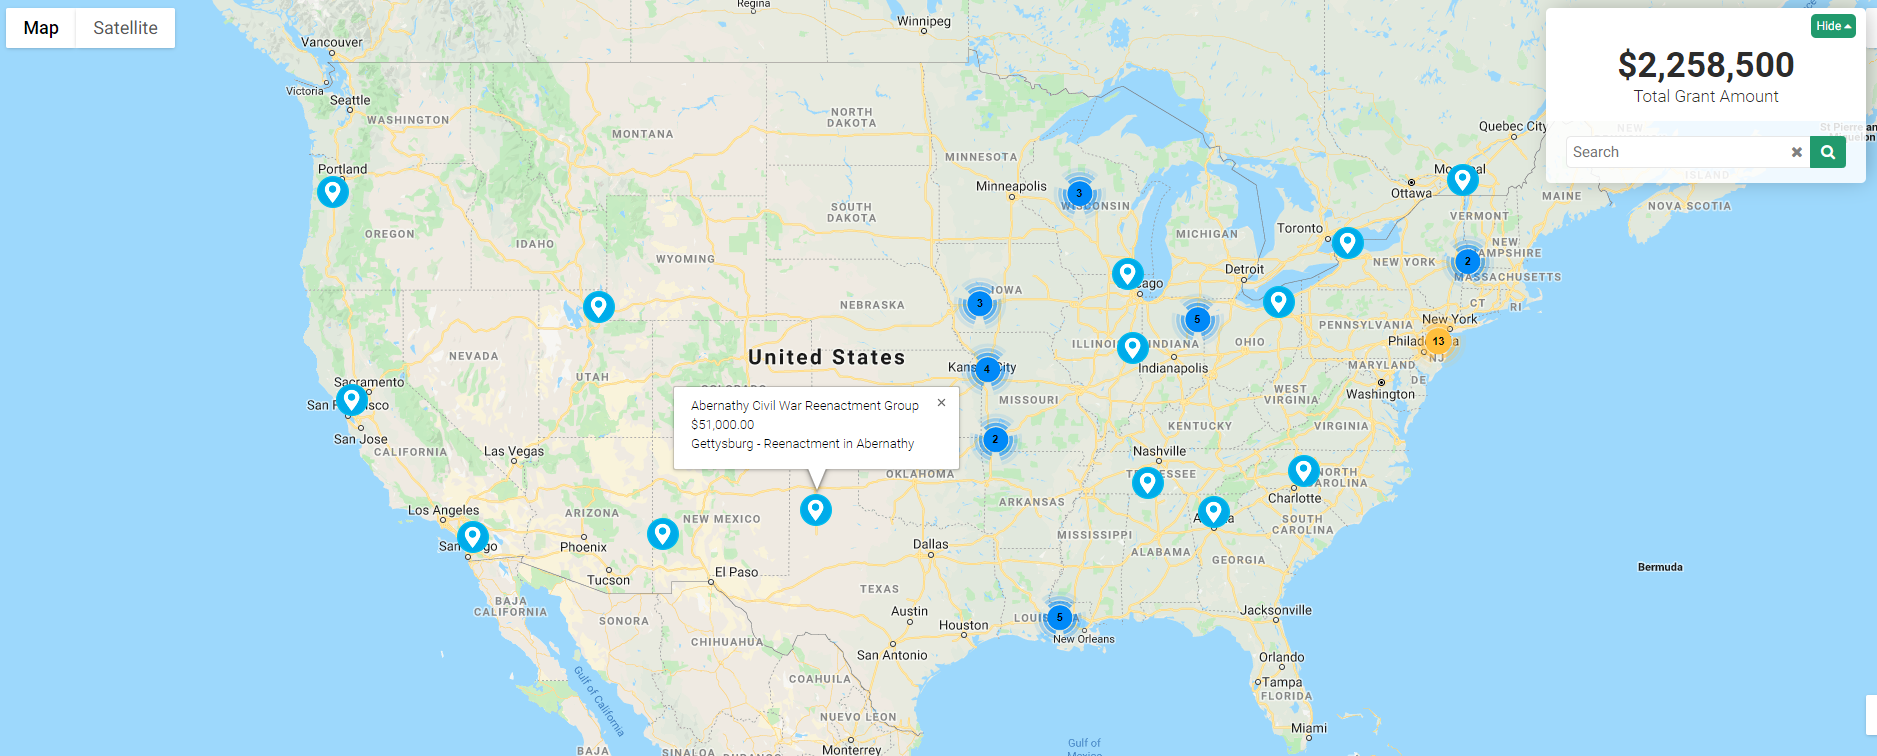
The Impact Map is a feature designed to plot records from a UTA onto a map interface, enabling the visualization of locations derived from UTA records.
This feature offers a distinctive approach for visualizing data through geomapping capabilities, frequently utilized to display the locations of grant impacts.
To configure an Impact Map, administrator access to the UTA used for generating the map locations is required.
Sample Impact Map Display
Configuration - Essentials
- Select the UTA to associate with the map based on the types of records intended for display.
- An Impact Map can be created using either Level 1 or Level 2 records within the UTA.
- Level 1 records are displayed on the Impact Map using the location of the organization (standard field: client) linked to the record.
- Level 2 records may be displayed on the Impact Map using a unique address defined through Geocode Field Mapping settings. Refer to the 'Configuration - Advanced' section for additional required steps.
- To plot records on the map, the standard fields 'Latitude' and 'Longitude' must be enabled on your records. Review your records' standard fields and enable these fields if they have not been previously activated.
- Note: Latitude and Longitude values must be stored in the record either by saving the record or by using the 'Retrieve Latitude/Longitude' workflow task type.
- Within the UTA Configuration Settings, navigate to the Level 2 tab and select the 'Impact Map Settings' link.
- Create a new map by clicking the (+) Create New Map button in the menu. Assign the map settings based on the parameters detailed in the 'Settings Explained' section below.
- After entering all map settings, save the map.
- Select the 'Generate HTML and JSON files' button to create the necessary files, which will be stored in your chosen SmartFolder. The URL of the HTML file will be available on the Impact Map configuration page. This URL can be used to navigate to the map and incorporated into portal design by referencing the relative URL in a custom page or portal section (e.g., /files/368847/f304276/11_impactmap.html).
Settings Explained
| Setting | Description |
| Name | The designated name of the map being created. |
| Description | Additional details or notes regarding the map. |
| Type Filter | Filters records displayed on the map based on their record type. |
| Type Filter | Filters records displayed on the map based on their record type. |
| Status Filter | Filters records displayed on the map based on their record status. |
| Amount Field | Specifies the field used for calculating the aggregate sum displayed on the map (e.g., Grant Total: $###). |
| Zoom Level | Defines the zoom level applied when the map loads at the selected Zoom Center. |
| Zoom Center | Specifies the default location where the map will center upon loading. |
| Auto Zoom | When enabled, the map automatically zooms to the area containing the records. If selected, the Zoom Level and Zoom Center settings are disregarded. |
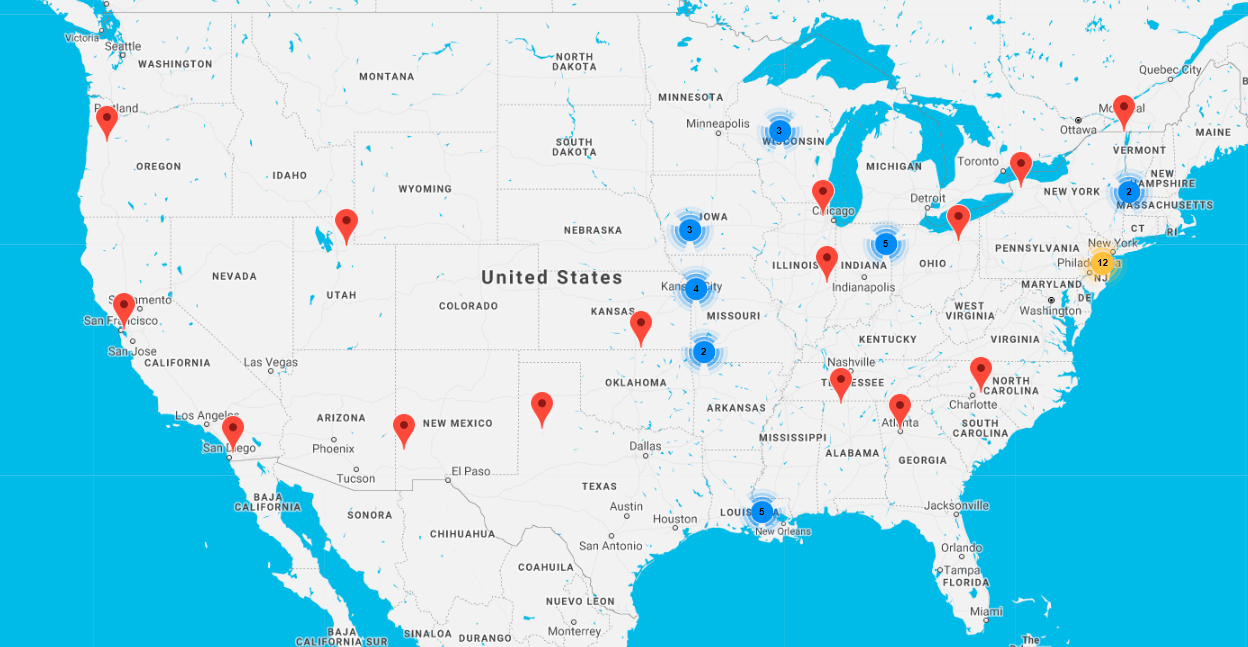
| Map Theme | Determines the visual style of the map. |
| Marker URL | Optionally references an image file to be used as map markers instead of the default Google Maps marker. |
| Information Fields | Selects the fields from the UTA record to display within the information box that appears when a map marker is selected. |
| Information Template | Allows the use of a custom template for displaying Information Fields on the map; this is optional. |
| KML | Enables the addition of KML file references to apply overlays on the map; this is optional. |
| SmartFolder | Specifies the SmartFolder within your SmartSimple instance where the map files will be stored. |
Map Theme Styles
Blue Water
Light Grayscale
Golden Brown
Retro
Configuration - Advanced
By creating a Level 2 Impact Map, you gain the flexibility to specify unique addresses for your locations and the capability to represent multiple locations for a single Level 1 record. For example, if a Level 1 Grant occurs in multiple locations, multiple Level 2 location activities can be created to plot several points on the Impact Map.
One method for creating Level 2 location activities is the use of an Advanced Data Table custom field on the Level 1 record, which is mapped to generate Level 2 records. This approach allows entry of multiple locations within the Advanced Data Table field, each of which automatically creates a Level 2 record.
When configuring an Impact Map using Level 2 records, several additional steps are necessary compared to Level 1 record maps.
- Ensure the 'Latitude' and 'Longitude' standard fields are enabled on the Level 2 object within your UTA. Access the Standard Fields list for the Level 2 object and enable these fields if not already activated.
- Create custom fields on the Level 2 object to store address components that will be plotted on the Impact Map. These fields should separately capture Address 1, Address 2, City, State, Country, and Postal Code.
- Establish Geocode Field Mapping on the Level 2 object. This feature calculates latitude and longitude based on the address information entered into the Level 2 custom fields.
- Navigate to your UTA configuration settings, access the Level 2 object tab, and click the link labeled Geocode Field Mapping.
- Define the Level 2 custom fields corresponding to each address component.
- Navigate to your UTA configuration settings, access the Level 2 object tab, and click the link labeled Geocode Field Mapping.
Address Mapping
- For the Level 2 record to store latitude and longitude coordinates, the record must be saved after entering the address details in the custom address fields. Alternatively, a workflow using the 'Retrieve Latitude/Longitude' workflow task type can be employed to automatically calculate these coordinates based on the address values. This workflow must be triggered after the address information has been entered in the Level 2 record.


