Overview
The SmartSimple reporting system, which is a fundamental component of our business operating system, enables users to manipulate both the content and presentation of data found in one or more SmartSimple tables. In contrast to a table, reports exclusively present data that satisfies the criteria defined by the user; they also have the capability to aggregate and display summarized data information.
You may utilize the reporting functionality within your SmartSimple instance without the need for additional software purchases or installations. Reports are entirely created through the standard interface and can be accessed from any browser, as well as via Microsoft Word or Excel, provided that the appropriate SmartSimple plug-in is installed.
Benefits of Reports:
- Consolidate data from one or more tables in a single location
- Group and aggregate data from multiple tables
- Visualize grouped data in various types of graphs
- Export data into any desired file format, or
- Enable Internet access so that reports can be linked to public websites
- Organize reports into tabs, facilitating the grouping of similar topic-based reports
- Duplicate and modify built-in reports to serve as the foundation for your customized reports
User role-based security determines who can view the reports created within your system. It is necessary to have System Administrator privileges to create reports from your SmartSimple system.
Report Components
The reporting system encompasses three primary components:
- Reports generated from underlying SmartSimple database tables; users can connect the necessary tables to create a report
- Graphs that users can create independently, based on existing reports, to display the report in a graphical format.
- Dashboards that present multiple charts on a single page
The following diagram illustrates the relationship between these three types of entities:
.jpg)
Charts
Charts serve to present information from a report in an easily interpretable graphical format.
- Users can create pie charts, bar charts, line charts, and table-type charts.
- Multiple chart types can be created for each report, allowing users to select from various charts associated with the report when displaying it.
- Typically, a “summary” type report is chosen as the basis for the chart, as this type of information is more effectively displayed in this manner.
A user can access the chart only if they possess permission to view the report upon which the chart is based.
Dashboards
A dashboard provides a single-page view of a collection of charts.
- When a user displays the dashboard, each report referenced by the charts is processed, and the current data is displayed in the charts on the dashboard.
- Users can create multiple dashboards to exhibit different sets of key indicators.
- A user can designate a specific dashboard as their home page within SmartSimple, providing immediate access to key information upon logging in.
Each dashboard requires appropriate permissions for the roles intended to access it.
Tables
To facilitate the creation of reports, some SmartSimple tables are presented in a denormalized format when using the Report Builder.
For instance, the contact record does not include the company name; these two tables are linked at the database level via the CompanyID field. Therefore, the contact table does not contain the company name field but rather a key field that connects to the company table.
However, when utilizing the contact table within the Report Builder, a field labeled Company Name will be displayed. This allows users to employ this field without necessitating a link between the two tables.
Configuration - Essentials
Report Permissions
Access to Reports is determined by System Roles - therefore, users must be assigned to a role that includes this feature. To enable menu access for Reports - System Roles that will be provisioned access must first be entered into the Reports - Menu Access configuration:
System Administration (gear icon) >> Global Settings >> Security (tab) >> System Feature Permissions >> Menu (tab) >> [Reports - Menu Access]
The abilities to Manage and Export Report Data are also a Role-Based permissions, and may be enabled at the System Role level by navigating as follows:
System Administration (gear icon) >> Roles and Security >> User Roles >> [Edit] *RoleName >> System Permissions (menu) >> Features (tab) >> Reports
Accessing Reports
A user granted permission for report access can view the reports available to them. To access reports within your SmartSimple system, please follow these steps:
Menu >> Reports
The list view of available system reports will be displayed.
The report window comprises the following sections along the top row of tabs:
- Reports: This displays a list of the current reports available in your system.
- Global Report Template: This tab is utilized to define a customized HTML template for all reports.
- Dashboards: This tab is used to create a dashboard for displaying a set of charts.
- Web Access Statistics: This tab presents statistics on the frequency of access for your web-enabled reports.
- Deleted Reports: This tab displays a list of any reports that have been deleted from your system.
You can filter the results of your report list by selecting a Category of reports, which can be found at the top right of your page. Reports that have not been associated with a category will appear under the Uncategorized category option. Clicking into the Category field will present a drop-down list of available report categories:

Additionally, you can manually search through reports using the Search bar located at the top right, just above the list view. If your results exceed the maximum number of records displayed on a page, you can navigate between different pages by selecting the next or back arrow icons at the top right. The count of records you are viewing out of the total will always be displayed next to these buttons. Any reports that have been Internet-enabled will have a black dot under the Internet Enabled column to indicate such status.
Report List Columns
Each report in the main list will feature buttons to the left, each serving various functions.

The functions are detailed in the table below:
|
Run Report |
Clicking this icon will initiate the report and present the results to you. |
|
Custom Export |
Clicking this icon will allow you to configure the information you wish to export from your SmartSimple report to external applications such as MS Word, MS Excel, or QuickBooks. |
|
Export File |
Clicking this icon will enable you to export your SmartSimple report to external applications in standard file formats such as MS Word, MS Excel, PDF, HTML, or others. This function offers less configurability compared to the Custom Export function. |
|
Edit Report |
Click this icon to access the editing options for this report. If the report is a built-in report, you will be able to examine its construction, but any modifications made will not be saved to the built-in report. To customize a report, you must create a copy of the built-in report and make further edits to the copy. |
- Any reports that are not enabled for certain features—such as File Export or Custom Export—will have the corresponding button icon greyed out next to the report name.
- To enable these features, simply click the pencil icon next to the report name, navigate to the appropriate tab of Custom or File Export, ensure that it is both enabled and configured to your specifications, then click Save. Upon returning to the report list view, the corresponding icon should now be clickable.
The columns in the report list view are described in the following table:
| Report Number (#) | The index of the report on the page. Please note that this page length, like all others, is determined by your Personal Settings - Number of Records Per Page. |
| Report Name | The name assigned to the report. An asterisk (*) is displayed in front of the Name field for any built-in reports. This field contains the narrative description of the report. |
| Report Description | The narrative description regarding the purpose of the report. |
| Roles |
This section displays a list of roles that will have access to the report. You must add the necessary roles to this list to make it available to other users (for instructions, refer to Report Tabs - the View Report field is located under the Security tab.
|
| Last Updated | This displays the date and time stamp indicating when the report was last updated. |
| Modified By | This displays the name of the individual who made the last modifications to this report. |
| Created By | This displays the name of the individual who initially created the report. |
| Internet Enabled | If the report is not Internet Enabled, the column will be blank. If the report is Internet Enabled, a black dot will be present in the column. |
| Report ID | The unique ID assigned to the report, shown as a read-only field. |
Please note: Any user will only be able to view the reports and functions for which they have permissions. If a user is authorized to create new reports, they will see a + icon at the top left, allowing them to create a new report.
Creating a Basic Report
To learn how to create a basic report, please follow the steps outlined below. Prior to these steps, ensure you are in the Reports list view (refer to the Accessing Reports section if assistance is needed).
- Note: If you possess numerous Custom Fields, access the reports tab within the application from which you are creating the report. If you are creating a report from a specific source, access the reports tab from that UTA.
1. Click the + icon located at the top left of the screen to Create a New Report.
2. The new report window will be displayed:

The fields on the new report page are described below:
| Report ID | The unique ID assigned to the report, shown as a read-only field. |
| Builder Type |
When creating a report, users will have the option to choose between the Neo or Classic Report-Builder. Neo - Refers to the Report Builder (Neo), a SmartSimple upgrade to the Reports tool that is designed to be more user-friendly and intuitive. Classic - Selecting the Classic builder type will enable a new tab called Recordsets to appear in the top row of tabs. This tab is utilized to select the necessary tables for the report, the relationships between tables, and the primary table. The primary table determines how the data will be joined when multiple tables are selected. |
| Name | The name of the report will be displayed to any users accessing the report. |
| Description | The narrative description of the report's purpose. |
| Category |
The category you wish to associate with this report. Entering a unique category name will consequently create a new entry in the Category field in the main Reports list view. Entering an existing category name will display this report in the existing category. When you view the main list view of reports, you will see a drop-down at the top right with all of the system's available report categories. |
| Lock | Do not rebuild report - Toggling on this option will indicate that the report should not be rebuilt. In the case of a custom Report Template, it will trigger an alert when the Report Builder button is clicked. |
The second tab following the General settings provides Advanced settings for how the report will be displayed, its external accesses, its caching options, and more. For additional information regarding the Advanced configuration, please refer to our Advanced Settings of Reports section.
Editing Reports
After clicking the Save button, the page will refresh and save your report within the system. You will then have the opportunity to edit this report with more detailed configurations.

The Builder Type will no longer be modifiable once you have saved your new report. Furthermore, the main report information will now include the Created By, Last Modified, and Last Modified By auto-populated fields.
To the right of the page will be the Notes tab that allows you to create new notes or view any existing notes associated with your report.
You will also be able to see the following new buttons at the bottom of the page: Save, Save As, Delete, and Preview.
- If you have not yet selected any table(s) or fields from tables in your Report Builder, you will not be able to view a preview of the report.
Copying a Report
- The Save As button located at the bottom of the General Settings page when editing any individual report will initiate a pop-up prompting you to enter the new name for your report. After entering a name and clicking OK, the system will create a copy of this report under the new name, and the list of reports accessed from Tools > Reports will be updated with this new copy.
When a report is copied, the configurations made in the Report Builder and on the Advanced, Security, File Export, Custom Export, and Report Template tabs will be transferred to the new report. However, Sub-Report settings and Charts will not be copied.
Report Tabs
If you have selected Classic Builder Type for this report, the following tabs will be displayed subsequent to the General settings tab.
| Recordsets | This tab enables the attachment of recordsets to your reports. |
| Advanced | This tab allows for the configuration of the advanced settings of your report. |
| Security | This tab permits the setting of permissions for the security of your report. A field labeled Allow View Report enables you to select which roles are authorized to view this report within your system. |
| Sub-Reports | This tab facilitates the creation of a "nested" report within the main report. |
| File Export | This tab allows you to configure the default export settings of the report. |
| Custom Export | This tab enables the creation of custom export settings for the report. |
| Scheduled Export | This tab allows you to schedule an export for a future date, which can be designated as either File Export or Custom Export. |
| Report Template | This tab allows you to control the layout and formatting of your report. |
| Charts | This tab permits the creation of one or more charts associated with the report. |
Each Classic Report Builder tab will soon have its own subsection within this article for further clarification, if necessary.
- Note: In Report Builder Neo, the only distinction is the absence of a Sub-Reports tab.
Adding a Table to a Report
The initial step in constructing a report is to add the necessary tables to the report on the Recordsets tab (located immediately after the General tab).
1. For instance, in the Recordsets tab, scroll down and designate the Primary table option for the Contacts table.
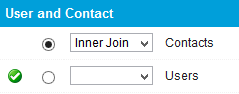
Selecting the primary table automatically assigns that table to the report.
2. Click the Save button located at the bottom of the page.
Launching the Report Builder
After you have Saved your new report, a four square icon will appear at the top left of your page above the report name.
Clicking on this icon will initiate a modal window displaying the Report Builder, either in Neo or Classic.
It is strongly recommended that all users utilize the Report Builder Neo for a more streamlined and intuitive experience.
- Please ensure that your Builder Type is designated as Neo to access the Report Builder Neo.
Classic Report Builder - Column Settings
In the March 2020 upgrade, the capability to create classic style reports was deprecated. Existing reports will continue to function; however, the ability to copy or create new reports utilizing the classic report builder will not be available.
Report Builder Neo is recommended for all users.
Each column will consist of the fundamental construction of the report by selecting the necessary fields and determining how the field should be utilized within the report.
Each report column comprises the following settings:
| Column Heading | The text that you wish to appear above each column in the report. Initially, this will be set to the same name as the field, but you may edit the text if necessary. If you wish to revert the text back to the Field name, you can click the button to the right of the column heading. |
| Recordset | This refers to the recordset that has been selected in the Recordsets tab. If multiple recordsets have been selected for the report, you can choose which one to use as a table for your report from the drop-down menu when you click into the field box. |
| Type |
When a specific recordset has been selected, the Type field box will present a drop-down of corresponding types. Depending on the selected recordset, you may choose from the category, role, template, or type from which your field will be derived. Example: If the Recordset you selected was Contacts, the corresponding Type would be derived from the available system roles. |
| Field | The field you wish to display in this column. All fields from all selected tables will be displayed in the field list; fields are organized alphabetically by table name and by field name. |
| Date/Time Translation | Utilized to "extract" the day, month, week, or year from a date field for comparative analysis. |
| Group By | Used in summary reports to group, sum, count, or calculate the average of the field. Also provides Total Group options for configuring report groupings and facilitating easier retrieval of total rows. |
| Sort By | Determines the sort order of the report results, either Ascending or Descending. |
| Align | Determines the alignment of the column header and column values. Options include Left (default), Center and Right. |
| Calculated Field | This option allows for the incorporation of additional complexity, such as mathematical operators and concatenation. This field also supports MySQL syntax. |
| Show |
Enabling this option will display the specific field data. An instance in which you might choose not to enable Show is if you wish to generate a list of salaries exceeding $100,000 a year and utilize the salary as a criterion, but not display the result. Left/Right Move Arrow Icons - These icons are located on the left and right of each Show checkbox and can be utilized to modify the column order. |
| Show Total | Enabling this option will display the total of all data accumulated from this column. |
| Criteria | This section allows you to establish the criteria for which records are to be displayed in a report. There are five columns available for setting criteria, each separated by the OR operator. |
- Note: If you wish to add additional columns, click on the More Columns button at the bottom of the page to add 25 more columns.
- There is a fixed limit of 50 columns for the Classic Report Builder. Should additional columns be necessary, you will need to utilize two reports linked together - refer to Merge Sub-Reports.
- Tip: The browser Mozilla Firefox will load the Report Builder more efficiently than Internet Explorer.
At the bottom of the page, there is a row of buttons:
| Build Query |
This button is utilized to create your report based on the fields and criteria you have selected in the Report Builder. When this button is clicked, the Report Builder will close, and you will be redirected to the Edit Report page.
|
| Clear All | This button will clear all fields, including calculated fields and specified criteria in the Report Builder, allowing you to commence anew. |
| More Columns | This button will add an additional 25 columns to the Report Builder, up to a maximum of 50 for any new Classic report. |
Classic Report Builder Help Panel
At the bottom of the Classic Report Builder interface, there exists a Help Panel featuring an upward arrow that, when clicked, will reveal various help options.

The Help menu comprises six tabs, each containing pertinent information related to the respective tab's subject matter.
| Overview | This tab offers descriptions of all components located in the top panel of the Report Builder, including column fields and their respective descriptions. |
| Comparison Operators | This tab elucidates the process of establishing basic criteria for logical tests. |
| Wildcard and Like Operators | This tab details how to set partial criteria. |
| Special SmartSimple Criteria Values | This tab explains how to set criteria based on user prompts and user attributes (such as user and company identifiers). |
| Date Comparison | This tab describes how to set date- and time-based data. |
| Calculated Field | This tab outlines valid mathematical expressions and functions, string functions, and logical statements for use in the Calculated Field section of the Report Builder. |
Report Builder Neo - Column Settings
Should your new report be saved under Builder Type - Neo, the Report Builder that is initiated will be the Neo version, rather than the Classic version.
The Report Builder Neo was introduced as an enhancement to our Classic Report Builder, offering the following advantages:
- A more intuitive interface with a higher degree of configurability
- Increased efficiency in creating targeted, impactful reports
- Utilizes your organization's terminology
The primary enhancement in Neo is its ability to streamline the process of finding, selecting, and setting up your information.
The Report Builder Neo is exclusively designed for creating new reports; existing reports created with the Classic Report Builder cannot be converted to Neo.
1. Click on the four-square icon located at the top left of your page to initiate the Report Builder Neo.
2. The Report Builder Neo window will appear as a modal window:

This window will include the following functions and fields:
| Number of Columns | You may add or remove columns as necessary for your report, up to a maximum of 100. |
| Dataset |
To add the primary dataset you will utilize for your report, click the + icon located at the top left of the Report Builder.
|
| Field | The field you wish to display in this column. |
| Column Heading | The text that you wish to appear above each column in the report. |
| Date/Time |
This option is used to "extract" the day, month, week, or year from a date field for comparative purposes. The options are illustrated in the screenshot below: |
| Group Options |
Used in summary reports to group by sum, count, or calculate the average of the field. Additionally, it offers Total Group Options for configuring report groupings and simplifying the retrieval of total rows. The options are depicted in the screenshot below: |
| Sort By | Determines the sort order of the reports, either Ascending or Descending. |
| Alignment | Determines the alignment of the column headings and the column values - Left (default), Center, and Right. |
| Formula | This field allows you to incorporate further complexity such as mathematical operators, concatenation, and supports MySQL syntax. |
| Display |
Selecting this option will allow the data from this column to be displayed in your report; if you prefer not to display it and only use it as criteria, you may uncheck this option, and the column data will remain hidden in the resulting report. Example: You may wish to generate a list of salaries exceeding $100,000 annually and use the salary as a criterion, but you do not want to display these results. |
| Show Total | Selecting this option will display the total of all data accumulated from that column. |
| Criteria | In this section, you can establish the criteria for which records are to be displayed in a report. There are five columns available for setting criteria, each separated by the OR operator. |


- The Report Builder Neo features Drag and Drop functionality to reorder the display of columns in a report and to input fields into the appropriate columns.
- The Report Builder will automatically recognize which base dataset your columns are associated with.
Additionally, you may utilize the Search functionality in the dataset field picker to refine your fieldset to those that include matches to a keyword search. Simply click on the Fields tab and enter your search term into the search box:

Deleting a Report
The user must possess the appropriate permissions to delete a report.
Batch Delete Reports
1. Click on the nine-square menu icon located at the top right corner of your page.

2. Under the heading Tools, select Reports. 3. Check the box to the left of all report names corresponding to the reports you wish to delete. 4. A trashcan icon will appear in the top left row of buttons once at least one report has been selected. Click on this button to batch delete all of your selected reports.

5. A confirmation message will appear on your screen. Click Yes to confirm the deletion. The reports will be deleted, and your list view of reports will refresh to reflect these changes.
Individually Deleting a Report
1. Click on the nine-square menu icon located at the top right corner of your page.
2. Under the heading Tools, select Reports. 3. Click on the pencil icon next to the name of the report that you wish to delete to enter Edit mode for that report. 4. The report details will be displayed, and at the bottom, there will be a Delete button among a row of other buttons. Click on the Delete button.

5. A confirmation message will appear on your screen. Click Yes to confirm the deletion. The report will be deleted, and your page will refresh, bringing you back to the updated list of reports.
View Deleted Reports
To view the reports that have been deleted from your system, whether by you or another user, you may click on the last tab in the Reports section of the system, titled Deleted Reports.
- Note: Only users with System Administrator privileges can access the Deleted Reports tab.

The list of deleted records will include columns indicating who deleted the report (Deleted By column) and when (Deleted Date column, presented as a date and time stamp).
Restore or Purge Deleted Reports
You must possess System Administrator privileges to view or modify reports that have already been deleted.
1. Click on the nine-square menu icon located at the top right corner of your page.
2. Under the heading Tools, select the hyperlink Reports.
3. The list view of reports will be displayed. Click on the last tab, labeled Deleted Reports.
4. The list of deleted reports in your system will be displayed.
5. Select the checkbox to the left of the report name of the report that you wish to either Restore or Purge.
Once you select this checkbox, two buttons will appear at the top left of your page beneath the tab labels. The reload button will enable you to restore the deleted report, making it accessible, viewable, and modifiable in your system once again. The trashcan icon will allow you to permanently delete this report, ensuring that it is not accessible even from the Deleted Reports tab.

- Note: If you choose to permanently delete a report, a pop-up confirmation message will appear. Click Yes to proceed with this purge.
Any reports that have been deleted for over one year will be automatically purged.
Configuration - Advanced
Advanced Settings of Reports
The second tab on the New Report page is labeled Advanced. This tab displays all the advanced settings that can be configured for the report.

The options for the Advanced tab are detailed in the table below:
| Criteria Text | Text used to prompt the user when they are required to enter some criteria values. This setting will also specify the introduction text, as well as labels for Custom Fields. Labels are defined by a hyphen (-) preceding the label (e.g.: "-First Name") and are applied to the criteria fields in the order that they are entered. |
| View Mode |
List View - Selecting this option will allow all records to appear in a list. Single Record View - Selecting this option means that each report will be displayed one at a time. |
| External Access | Internet Enabled - Activating this function will generate a URL that allows the report to be accessed over the internet without requiring a user to log into the system. This setting is useful for creating public reports. |
| OData Connector |
Activating this option will utilize the Open Data Protocol to facilitate data-sharing across disparate applications in enterprise, Cloud, and mobile devices.
|
| Disable Global Template | Activating this option will disable the Global Report Template (a personalization of HTML header/footer for all system-based reports) for this specific report. |
| Interactive View Display |
None Display Link to Interactive View - Open Report Directly in Interactive View - |
| Total Label | Provide a name for the Total column. Refer to Using Total Group Options in Report Builder for additional information. |
| Enable Translation |
Allows report headers and associated charts to utilize translation options available in the system's Language Library.
|
| Enable Straight Join | |
| Enable Pivot View |
Enables pivot functionality; this allows for the option to perform an aggregate function and pivot the grouped columns across the x-/y-axis when grouping by two different columns.
This example report utilizes "Pivot View" with data grouped by "type" and "status". Users can select their desired group options via the drop-down menu. |
| Merge Sub-Reports | Facilitates the merging of two Classic builder type reports. |
| No Name URL Parameter | |
| Hide Custom Export | This option will conceal the ability for a user to Custom Export this report by hiding the custom export icon |
| Hide File Export | This option will conceal the ability for a user to File Export this report by hiding the export icon |

Report and Field Caching
By scrolling further down the Advanced Settings tab, you will have the opportunity to modify the caching functionality for reports and fields.

| Report Caching |
Caching Options: Enable - Activating caching is a beneficial feature that can enhance loading times and alleviate processing demands on the server. This feature is particularly advantageous for complex reports and those that are frequently accessed.
Caching Options: Cache By User - User-specific caching is necessary when a report incorporates criteria that filters based on the user accessing the report (i.e. =@userid@). Cache Life Span - Please specify an appropriate cache lifespan in minutes. Instead of re-generating the report each time it is executed, caching preserves the results for the duration indicated in this field. Upon the initial viewing of a report, it will be generated by querying the database, and live data will be presented. Any subsequent viewers of the report, within the specified lifespan, will see a cached snapshot of the report.
|
|
Field Caching
|
Frequency - The frequency of field caching can be configured as follows:
Identifier Column - Select a report column from those available in the Report Builder that will uniquely identify the record to be updated. This serves as the match field as it indicates the field that enables the system to identify which record to update. Column Field Value Column - Select a report column from those available in the Report Builder for the data you wish to store; this acts as a source field since the setting represents the values that the system will utilize to update the Custom Field specified in the subsequent field. Custom Field - Select a dataset-specific Custom Field where the dataset will be stored. This serves as the destination field as the custom field will be updated each time the report is executed. Last Run - This will display a date and time stamp indicating the last occasion on which the field caching or scheduled report was executed. |
Internet-Enabling Reports
The capability to Internet Enable a report is advantageous as it allows the report to be made public, providing real-time access to the report over the Internet. This process generates a URL associated with the report, which can be linked to your website or distributed via email or other communication methods.
- Individuals who click the link do not need to possess login credentials for your SmartSimple system.
- Upon clicking the link, the report is processed, and the results are displayed accordingly.
The following steps pertain to reports generated using Report Builder Neo; however, the Classic Report Builder follows a similar procedure for Internet Enabling reports.
1. After accessing the Reports section of your system (refer to Accessing Reports if necessary), click on the pencil icon adjacent to a specific report name to Edit it.
2. Select the second tab labeled Advanced.
3. Locate the field External Access. Activate the Internet Enabled feature.

| Access Key |
If you wish to password-protect your Internet-enabled report, please enter a customized access key that the user must possess to view the report results, even if they have access to the URL.
|
| URL | This is the standard URL that will display the report results in the user's browser as a web page. |
| Export URL | This URL, when entered into a browser, will facilitate the downloading of the report onto the recipient's computer, which can then be opened in various file formats of their choosing. |
| Export URL-XML | This URL, when entered into a browser, will allow the report to be downloaded onto the recipient's computer in an XML format. |
- The URLs for Internet-enabled reports are generated automatically. Simply copy and paste them for use.
4. Click Save.
- Note: You can always determine whether a report is properly Internet-enabled if it displays a black dot in the Internet-Enabled column in the main reports list view, accessible via Tools > Reports. Refer to the screenshot below.

Language Translation for Internet-Enabled Reports
Users now have the capability to add a parameter to the Internet Enabled URL of all reports, allowing results and column headers to be tailored to specific languages, provided that corresponding translations have been configured for the fields.
The parameter utilized is lang, followed by the ID of the language into which the report should be translated.
In the example below, the parameter lang=2 is employed to translate the report into French.
https://test.smartsimpleqa.com/ex/ex_viewreport.jsp?key=&token=%40GgUNSxoaeFxbSxRdSRxRRVdQZFB3H3Q~&lang=2
Reports vs List Views
SmartSimple offers various methods for data presentation. Specifically, list views and Reports are among the most favored and highly customizable options. A critical question arises regarding when it is appropriate to utilize a list view as opposed to generating a report.
| Benefits | Considerations |
|
A report is necessary if your situation meets at least one of the following criteria:
|
Reports are subject to greater sensitivity due to the following reasons:
|
Exporting Reports
- If you wish to export the report data to any other data format (for instance, comma-separated values), you may utilize the Export settings for the report to create the desired file format.
- Additionally, this method can be employed to create a MS-Excel or MS-Word file, without the necessity of utilizing the Plug-In application.
File Export
- Export Format - a dropdown list of various file formats to which you can export the report.
- Folder Type - can be exported to either a SmartFolder or a System Folder.
- Folder - select the subfolder where you wish to export the file.
- Data Position - designates the starting position of your list view results (the "data").
- Meta Data Position - indicates the starting position of the report criteria (the "metadata"). If your report does not utilize [wiki/Criteria criteria], the Meta Data will be blank.
- Export File Name - specify a filename that will be applied when the report is exported. If left blank, the default name for the exported file will be "Book".
Note: The syntax for both the "Data Position" and "Meta Data Position" fields is ''worksheet'';''column'';''row''. The default setting is 0;0;0 for both fields. This indicates that your list view results will be exported, with the topmost, leftmost value appearing in the first worksheet, in cell A1. The numbering begins at zero, hence the first worksheet, first column, or first row would be referenced as 0, rather than 1.
Therefore, if you desire either the list view results or the metadata to be placed in the
third worksheet of your Excel file, starting in cell B4, you would enter ''2;1;3''
The syntax for the first worksheet, cell A1 would be ''0;0;0''.
File Extension
A report can be exported into a flat file with the following file extensions:
- txt – Windows Notepad.
- xls – Microsoft Excel.
- iif – QuickBooks.
- csv - Comma Separated Values.
- xml - Extensible Markup Language (can be opened in Notepad).
1. Set the Extension to txt.
![]()
The extension txt is typically associated with Notepad.
2. Click the Save button.
3. Click the Edit Report button.
4. Click the Reports tab.
The report list will be displayed, and the Employee list report will now be shown with an Export button.

5. Click the Export button.
Depending on your Browser and Security settings, you may need to respond to certain prompts before the file can be opened.
6. If necessary, click the Open button.
The file will open in the associated application – Notepad.
The file name will be set to the report name plus the specified extension.

7. Close the Notepad application.
IMPORTANT: In order to support special characters such as French accented letters, euro symbols, etc., SmartSimple employs UTF-8 encoding. When opening exported files, Microsoft Excel consistently imports using ASCII, resulting in special characters not appearing correctly. This is a limitation of Excel.
Exporting Reports with Special Characters to Excel
To accommodate Special Characters, such as French-accented letters, Euro symbols, etc., SmartSimple utilizes UTF-8 encoding throughout the system, including during report exports.
When opening files, Microsoft Excel consistently imports using ASCII, which results in special characters encoded in UTF-8 not displaying correctly.
- This is a limitation of Excel.
To successfully export data containing special characters from SmartSimple to Excel, please utilize one of the procedures outlined below.
Import Data
- Open a blank worksheet in Excel.
- From the Data menu, select Import External Data followed by Import Data.
- The steps may vary slightly depending on your version of Microsoft Excel. Please consult the Microsoft website or the Help menu in Excel for further assistance.
-
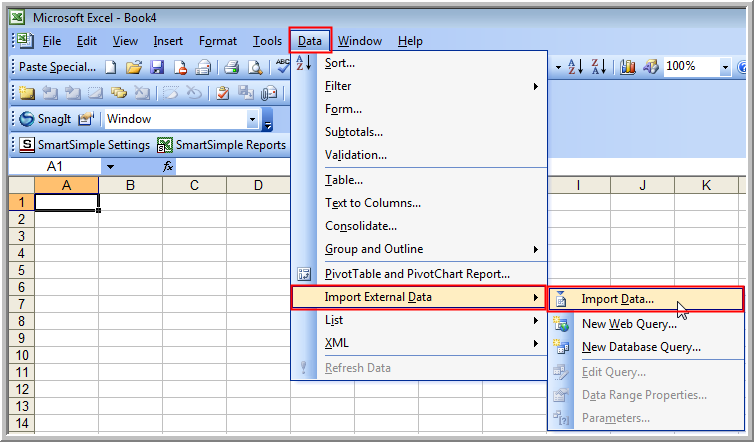
- Navigate to the location of the exported report .txt file and click Open.
- Select Unicode (UTF-8) as the File Origin and click Finish (UTF-8 typically appears near the bottom of the list).


Select the cell where you wish to place the data and click OK.
CSV Data Security
When exporting data in CSV format, files may be susceptible to malicious CSV injection attacks. As a precaution, an additional space will be prefixed to any values that begin with at signs ( @ ), plus signs ( + ), minus signs ( - ), piping symbols ( | ), or equals signs ( = ). Consequently, when exporting a file from Platform3 to CSV format and subsequently importing it into another system, please ensure to remove the additional space preceding any values.
Copy and Paste from Notepad/Wordpad
- Configure the report to export with txt as the file extension.
- Export the report.
- Open the report in Notepad or another text editor.
- You may need to right-click on the file and select Open With depending on the application your PC is configured to use for .txt files.
- Select and copy the entire text of the report (Ctrl-A followed by Ctrl-C).
- Open a blank worksheet in Excel.
- Select the top-left cell and paste the copied text (Ctrl-V).
Note: Notepad may not support the opening of very large reports; therefore, it is advisable to use another text editor such as Wordpad or Notepad++. Microsoft Word is not recommended.
Note: When utilizing the Copy and Paste method for csv exported files, it is necessary to employ the Text to Columns function of Excel after completing the aforementioned procedure.
Note: If the report contains sub-reports, you must establish the Custom Export settings for each of the attached sub-reports.
CSV Data Security
When exporting data in CSV format, files may be vulnerable to malicious CSV injection attacks. As a precautionary measure, an additional space will be added at the beginning of any values that start with at signs ( @ ), plus signs ( + ), minus signs ( - ), piping symbols ( | ), or equals signs ( = ). Therefore, when exporting a file from Platform3 to CSV format and subsequently importing that file into another system, please ensure to remove the additional space preceding any values.
Export to XML
By changing the File extension to xml, the report will generate an XML document based on the report results.
1. In the Header section, enter the XML declaration and open the root element, details:
<!--?xml version="1.0" encoding="ISO-8859-1"?-->{BREAK}
<details>{BREAK}
2. In the Detail section, add the child elements. In the example below, the child is employee with subchildren firstname, lastname, salary, and startdate.
The {TAB}s and {BREAK}s will provide the XML document with proper indentation:
{TAB}<employee>{BREAK}
{TAB}{TAB}<firstname>@Users - First name@</firstname>{BREAK}
{TAB}{TAB}<lastname>@Users - Last name@</lastname>{BREAK}
{TAB}{TAB}<salary>@Users - Salary@</salary>{BREAK}
{TAB}{TAB}<startdate>@Users - Start Date@</startdate>{BREAK}
{TAB}</employee>{BREAK}
3. In the Footer section, close the root element:
</details>
4. The Export XML document as opened in Notepad:
<?xml version="1.0" encoding="ISO-8859-1"?>

<details>
    <employee>
        <firstname>Peter</firstname>
        <lastname>Jahl</lastname>
        <salary>25000</salary>
        <startdate>11/05/2003</startdate>
    </employee>
    <employee>
        <firstname>Herry</firstname>
        <lastname>Lee</lastname>
        <salary>55000</salary>
        <startdate>27/02/2005</startdate>
    </employee>
    <employee>
        <firstname>Peter</firstname>
        <lastname>Manlee</lastname>
        <salary>75000</salary>
        <startdate>12/05/2001</startdate>
    </employee>
</details>
Exporting with Subreports
To export a report that contains subreports or merged reports, it is necessary to define the Advanced Export Settings for both the subreports and the main report. Example:
- The following will export a report and subreport in Comma Separated Values format (CSV):
@Companies/Accounts - Company name@,
@Companies/Accounts - Address 1@,
@Companies/Accounts - City@,
@Companies/Accounts - State@,
@Companies/Accounts - Company ID@,
@subreport_0@
{BREAK}
Custom Export
The Custom Export settings enable users to customize the information they wish to export from SmartSimple to external applications such as Microsoft Word, Microsoft Excel, or QuickBooks.

This window comprises the following settings:
- Header - Static or variable elements that should be displayed at the top of the export file.
- Fields - A list of fields derived from the report utilized to create the export. Additionally, two special settings can be selected: {tab} – which adds a tab character to the specification, and {break} – which adds a line feed to the specification.
- Detail - This area allows you to construct the actual record layout for the specification. It may consist of multiple lines.
- Footer - Static or variable elements that should be displayed at the bottom of the export file.
- File Extension - The extension you wish to associate with the export specifications. By setting this value to any valid Windows file extension, the appropriate application will be launched when the data is exported.
Additional settings include:
- Delimiter - tab character ({TAB}), comma, semi-colon, colon.
- Line breaks - utilize either a UNIX line break ({LINEFEED}) or a Windows line break ({BREAK}).
-
Aggregate Functions in Header or Footer
- COUNT - counts the total rows per report. @COUNT(column_name)@
- SUM - calculates the sum of a column in the report. @SUM(column_name)@
- Current Date - adds the current date using the standard format YYYY, YY, MM, DD, HH, mm.
- Calculation can also be utilized in the header or footer.
Using Custom Export to Export in Excel
1. Click the Reports tab.
2. Click the Edit button for the Employee List report.
3. Click the Custom Export tab.
You can specify the layout of the report to be exported on the subsequent screen.

Header section: you will specify the column headings for your report to be exported.
Fields drop-down: provides a list of variables that correspond to the fields selected in the report through the report builder.
Details section: you will specify the fields for the report to be exported. The fields you select will be displayed from right to left in the exported report, so please select the field for the last column first.
4. Change the Extension to XLS or CSV.
5. Save the Layout.
6. Return to the Report list and click the Export button.
The File will open in Microsoft Excel.

Export to SmartFolder or SFTP
Reports can now be automated for export according to a schedule on a daily, weekly, or monthly basis to a SmartFolder or an external SFTP site.
Scheduled Report Export
- System Administrators can schedule report exports to run periodically (daily, weekly, monthly, quarterly, yearly).
- Scheduled report exports can be configured to export a file to 1.) a SmartFolder/System Folder, or 2.) a sub-directory of an SSH File Transfer Protocol (SFTP) server.
Configuration - Essentials
Scheduled Report Export is developed utilizing SmartSimple's integrated reporting subsystem. The configuration settings for scheduled report export can be accessed on the File Export tab of the Edit Reports page.
On the Edit Report page, navigate to Export in the left-hand menu, followed by selecting the Scheduled Export tab.

The following settings are available in the Scheduled Export tab:
- Export Type - specify the type of export for the scheduled operation.
-
Options:
- File Export - export file based on settings from the File Export tab.
- Custom Export - export file based on settings from the Custom Export tab.
- Export File Name - the file name can be specified, including a timestamp. It is advisable to append a timestamp. To include the date, use [YYYY],[YY],[MM],[DD],[HH],[mm]. For example, MyExportedReport_[YYYY]-[MM]-[DD].
Please note that the file extension should not be included in this section, for instance, PaymentDetails_[YYYY]-[MM]_[DD] and NOT "PaymentDetails_[YYYY]-[MM]_[DD].csv". The file extension should be specified in the a.) Export Format dropdown in the File Export tab for standard File Export or b.) File Extension textbox in the Custom Export tab for custom export reports.
- Do not export file when no record found - no file will be exported when this toggle is enabled.
- Export with Linked Reports - this feature allows for the extension of the number of columns beyond the current limit by joining multiple reports. This feature is exclusively available for report exports using the File Export format.
- Activate - this toggle must be enabled for scheduled or on-demand export.
-
Run Type - select from the dropdown
- On Demand - utilized when the report is linked to an autoloader.
- Scheduled - select the frequency for scheduled export of this report.
- Frequency - specify how often the report should be exported.
-
Options:
- Every Day
- Every Week
- Every Month
- Every Year
- Custom
- Hours - specify the time for the scheduled export.
- Start Date - specify the start date for the scheduled export.
-
Export to Folder - the file can be exported to
-
Folder Type - select a folder type where the file will be exported.
- Configuration Folder
- SmartFolder
- Folder - select the subfolder where you would like the file to be saved.
-
Folder Type - select a folder type where the file will be exported.
-
Export to SFTP
- Integration Key - select an existing integration key from the Integration Key Management dropdown list or click the "+" icon to create a new integration key.
- SFTP Folder Path - specify the SFTP folder location where the files will be pushed, e.g., /in or /out or /Payments/inbound.
-
Encryption - the exported file from this report can be encrypted by adding the PGP Encryption Key
- PGP Encryption Key - select the key from the dropdown. If the keys are not added, you can add them.
- Encrypt file exported to selected folder - enable if you want the file sent to the SmartFolder/Configuration Folder to be encrypted.
- Encrypt file exported to SFTP - enable if you wish for the file sent to the SFTP to be encrypted.
-
Process On Every Record After Export
- Update Status - updates the status of each record in the report to the selected status from the dropdown list. Please note that a status change will trigger any workflows associated with the status being changed. Workflows will be activated with this change of status.
- Trigger Workflow - the selected workflow will be triggered for all records after export.
It is important to note that Update Status will be processed prior to the triggering of Trigger Workflow .
- Link Report Export - select another report that you wish to link to this report for processing after this report has been processed.
-
Send Email Notification On Completion - allows for the emailing of a list of users and/or roles that will receive the exported file as an attachment.
- Email Template - select an email template for the emails sent to the selected users.
- Roles - send emails to users based on their roles.
- Select Users - select users to whom the email will be sent.
- Attach Exported File in Email - option to attach the exported file to the email sent out. This is applicable only when the file is exported to a SmartFolder or a Configuration Folder.
-
Send Email Notification When Export Failed - select users to whom notifications will be sent
- Users - select users to whom you want to send failure notifications.
-
Scheduled Export Status
- Last Scheduled Exported - date and time of the last scheduled export.
- Last Run - date and time of the last run.
- Ad-Hoc Run - date and time of the last Ad-Hoc run.
Example of Configuring Schedule
- Export Every Monday of the week at 0900
- Select a future date that falls on a Monday for the Start Date, Weekly for the Frequency and select the Time of Export from the dropdown list.
- Export Every 15th of the month
- Select 15th (future date) for the Start Date and Monthly for the Frequency and select the Time of Export from the dropdown list.
History Log

- # - item number.
- File - filename of the exported file.
- File Size - size of the exported file in kilobytes.
-
File Export - status of the exported file.
- Success - the file was successfully exported.
- SFTP Failed - the file was not exported to the SFTP.
- Save to Folder Failed - the file was not exported to the SmartFolder/System Folder.
- Saved to Folder; SFTP Failed - the file was exported to the SmartFolder/System Folder but was not sent to the SFTP.
- Save to Folder Failed; SFTP Failed - the file was not exported to the SFTP and to SmartFolder/System Folder.
- Empty Report; No File Created - the file was created without any records or no file was created.
- Saved to Folder Failed; SFTP Sent - the file was exported to the SFTP but was not saved to the SmartFolder/System Folder.
- Start Time - date and time the file was processed for export.
- End Time - date and time the file export was completed.
-
Status - status of the scheduled report export
- Started - when the file is being created.
- Completed - the file was exported successfully.
- Failed - the file failed to be exported.
- Interrupted - the process was terminated, e.g., due to an abrupt server restart.
- Run By - name of the user who initiated the file upload.
- Error - displays error messages, e.g., SFTP error: #Error: Permission denied.
- Process ID - unique identifier for the process.
Troubleshooting
-
- This functionality will not operate for reports that contain any criteria or variables requiring a user session or input—such as the setting that allows for the selection of a template from a SmartFolder prior to exporting. Reports that fail to comply with these criteria may either not be exported, yield no data upon export, or result in other unpredictable outcomes.
- To reset or modify the schedule, please Disable the Frequency setting, then save the changes. This will remove the current configuration settings from the database. Subsequently, enter the new schedule settings and save.
Exporting Reports with Total Group By
When exporting to Excel a report configured using Total Group By, it is essential to utilize the Custom Export:

Within the Detail section, wrap the Total Group By fields within a new row enclosed by <ssTotalTag> </ssTotalTag>.
(Note: In the provided example, the Display Total Label is blank, resulting in the label in the Custom Export displaying as @@.)
After the ssTotalTags, append <ssTotalHeader> </ssTotalHeader> to the end of the Detail section. This will enable the Total Group By headers to be displayed.
ReportProperty2()
ReportProperty2() is a SmartSimple reporting variable utilized within report templates and custom scripts to dynamically retrieve or manipulate properties associated with a report. This function is typically employed when incorporating criteria-based values or metadata into generated reports.
This function is part of the Report Variables framework, which enables developers and administrators to inject dynamic content into reports without hardcoding values.
Syntax
@ReportProperty2(reportid,property,,"@criteria1@::@criteria2@")@Parameters
- reportid represents the system ID of the report.
-
property may be one of the following:
- recordcount - The count of records within the specified report.
- csvdata - Report data with fields separated by commas.
- exportdata - Report data formatted according to the Advanced Export settings of the report.
- criteria1, criteria2, etc., correspond to the responses to the ??? prompts within the report identified by reportid. criteria1 matches the first instance of the ??? prompt in the Report Builder, criteria2 matches the second instance, and so forth, proceeding from left to right.
Return Value
- Returns the string value of the specified property, filtered by the provided criteria if applicable.
- If the property or criteria is invalid, the function returns an empty string.
Usage Examples
@ReportProperty2(12345,exportdata,,"@fullstartdate@::@fullenddate@")@
- The report with reportid 12345 includes criteria on a date field of ">=???" and "<=???".
- This example generates the number of records in the report for the date range from startdate to enddate.
Notes
- Use double quotation marks, not single quotation marks, to enclose criteria.
- When the ReportProperty variable is used in a Custom Field, the report executes each time the record is opened. Therefore, use this functionality judiciously to avoid potential impacts on server performance. It is advisable to place the ReportProperty2 function on a web page view of the record, allowing it to be executed or viewed on demand.
- Read-only fields utilizing ReportProperty2 should never be included in List Views. In general, all read-only fields should be avoided when designing List Views.